
Start having them & study the enclosed illustration for some nice historical data points ?
25 Calendar Years (1996-2020)
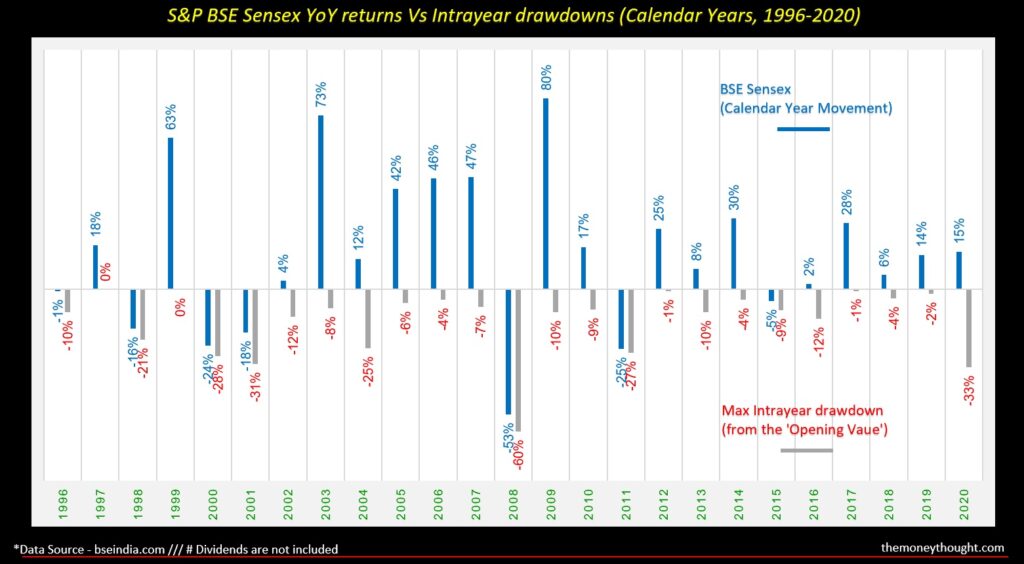
S&P BSE Sensex Index performance
Data points in the illustration are – Calendar Year returns (every year) (blue lines) & What was the maximum % drop in the index in that particular calendar year from it’s opening value (from 1 Jan to 31 Dec) (grey lines)
My Conclusions:
THERE IS NOT A SINGLE YEAR IN WHICH THE SENSEX DIDN’T GO DOWN, INTRA-YEAR (Meaning, 100% of the time, the index went down from it’s opening value, during a calendar year) ??♂️
18 Calendar years, Index gave a POSITIVE RETURN (72%) & 7 Calendar years, it have a NEGATIVE RETURN (28%)
(Meaning, my theory of investing on 1 Jan of every year has a Positive Return probability of 72%, for that year) ?
14 years it delivered DOUBLE DIGIT returns (56% of the time)
4 years, a SINGLE DIGIT return (16% of the time)
7 Calendar years, a NEGATIVE return (28% of the time)
Now on the Drawdowns …
0 – 10% max drawdown – 16 calendar years (64% of the times) (The probability of the Index going down during the year is 64%, after investing on 1 Jan ?)
11 – 20% max drawdown – 2 calendar years (8% of the times) (The probability of the Index going down by this much during the year is just 8%)…. So much for our wait to invest when the markets correct ?
20 – 30% max drawdown – 4 calendar years (16% of the times) (Well, this happens more frequently than the 11-20% falls)??
Last but not the least….
30% & above fall in a calendar year – 3 times did it happen within a Calendar year 2001, 2008 & 2020. That’s about 12% of the time
Within a year, if the Index goes down….No Worries, 72% probability that it’ll end on a Positive Note ?
I can go on & on with more data point dissections but the bottom-line is…..
Keep Investing
Don’t worry on the evergreen drawdowns which repeat Year after Year, Every Year ?